Pulse, Vampires, and Ghosts: The New Vitality Scale for TV
Total Viewers is a lagging indicator. I re-ranked 2025 ratings using a new "Vitality Filter." Forget the Top 10; meet the new ecosystem: The Vampires sucking out value, the Ghosts haunting the EPG, and the few Pulse networks keeping the industry alive.
Total Viewers is a lagging indicator. It tells you where a network was, not where it is going.
Every year, Variety publishes the ‘Most Watched Networks’ list based on L+7 data. It’s one of my favorite data drops of year (I used to analyze it deeply for Variety Intelligence Platform and later for FASTMaster). And yet, every year, the industry makes the same, headline-driven, mistake: confusing Scale with Vitality.
I’ve analyzed the same 2025 dataset, but didn’t just look at who is biggest. I looked at Velocity (who is crashing?), Efficiency (who has the best demos?), and Business Model (who is protected?).
When you apply this ‘Vitality Filter’ to the raw numbers, a different reality emerges. The leaderboard changes. Giant (in today’s landscape anyway) cable networks move from being top 10 must-haves to ‘Vampires’ sucking value from the system, while smaller networks reveal themselves as ‘Strongholds’ keeping the ecosystem alive.
The Old Way (Rank by Size) | The FASTMaster Way (Rank by Vitality) |
#11 USA Network (472k) | 🧛 Vampire (Blood-Sucker) |
#39 Bravo (374k) | 🏰 Stronghold (High Value) |
I’m proud to present the first of a 6-part series where I will be examining the state of traditional TV under new light. This takes on new credibility in the light of Paramount’s ongoing attempted hostile takeover of WBD as the crux of the argument centers on the future valuation of WBD’s cable portfolio.
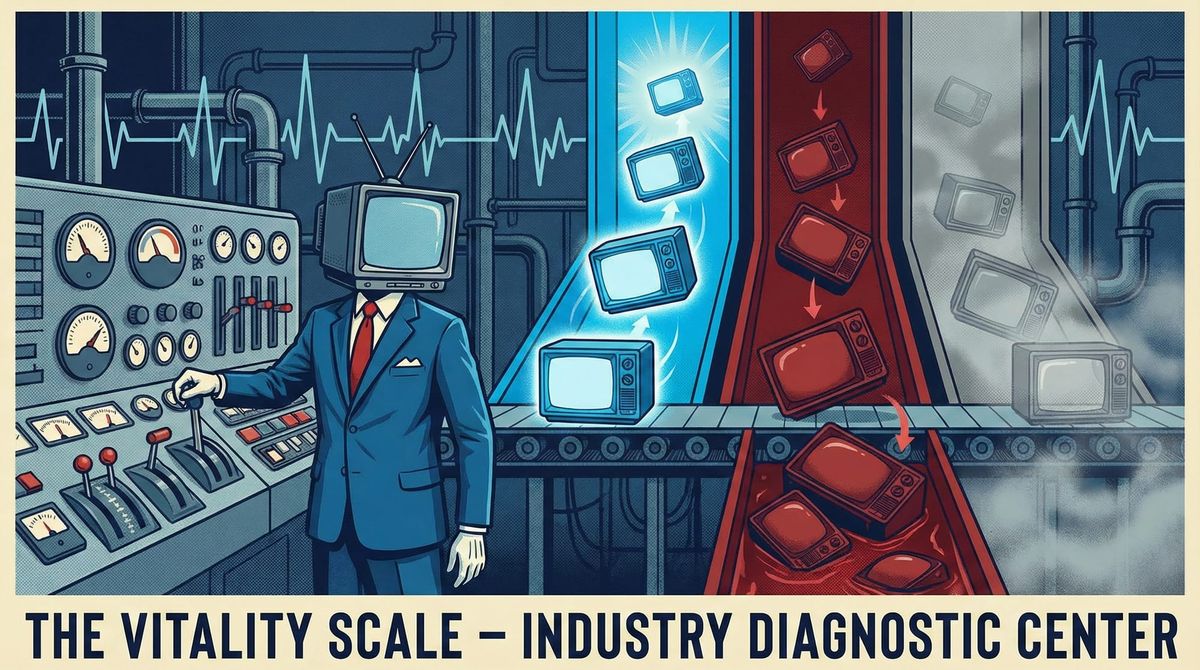
Let’s begin by defining the framework I developed for TV network vitality.
Network Type | Definition |
〽️ Pulse (The Elite) | Growing, or dominant in the demo. (Example: ESPN, Fox News) |
🧛 Vampire (The Extractors) | Huge scale, but bleeding out viewers. Surviving by sucking up legacy carriage fees. (Example: MS Now, TLC, History). |
🏰 Niche Stronghold (The Protected) | Small but mighty. Protected by Sports, News, or "Rabid Fan" demos. (Example: Bravo, Adult Swim). |
🪳 Cockroach (The Survivors) | The anomaly. While the industry shrinks, these networks hold steady or grow by serving a specific, loyal niche. (Example: Fox Sports 1, Reelz, Dabl). |
🧟 Zombie (The Walking Dead) | Mid-sized, generic, shrinking. Relying on reruns. (Example: TV Land, Travel Channel). |
👻 Ghost (Already Dead) | Statistical noise. (Example: Logo, Destination America). |
Of the 154 TV networks that Nielsen ranked (with an average primetime audience of 1k or more), just 12 were found to have a pulse using the FASTMaster Intelligence framework. That’s 8% of TV. These networks were judged to be living based upon present-day key factors of having a high 18-49 demo share, typically greater than the top 50 average of 25.2%, and their scale. With a few exceptions, they can be trusted to deliver a decent demo in primetime.
The industry is being propped up by 11 legacy giants and one cowboy channel. First we have the Big 4 English broadcasters (CBS, NBC, ABC, Fox). These are the undeniable volume kings. Even with declines, they are the only places to 3M+ viewers nightly, protected by the biggest and best of live sports. They are the “Anchor Tenants” of the entire video ecosystem, even if Fox is the only one to see an 18-49 demo share (28.2%) greater than the industry average* (25.2%).
*Industry average calculated among top 50 18-49 audiences.
The Big 4 are joined by the two Spanish broadcaster giants, Telemundo & Univision. These networks don't just skew younger; they directly reflect the seismic demographic shift of the modern American audience.
Only 5 Cable networks remain in the elite tier. Of these, one is rapidly aging out (Fox News), and three are close to becoming vampires (USA, TBS, TNT), with TNT increasingly under pressure to maintain 18-49 relevancy with the loss of primetime NBA games.
Finally, we have Grit TV. An OTA channel powered by reruns of classic Westerns, it looks at first glance to be out of place on this map. But not only is it a top 25 TV network, it is one of the few to see a positive upward audience velocity versus 5 years ago.
"The 'Pulse' isn't one-size-fits-all. In the chart, we see the divide. Above the dotted line are the 'Future-Proof' networks (Fox, Univision) that deliver both scale and young viewers. Below the line are the 'Legacy Giants' (CBS, NBC, ABC, Fox News) that rely on massive volume to offset their aging audiences. Both have a pulse, but they are beating at very different rhythms.
Getting back to the framework definitions set out earlier in this analysis, whilst I’ll dive into these individually during this series, I did at least want to pull out what the lay of the land is here.
Network Type | Channel Count |
〽️ Pulse (The Elite) | 12 |
🧛 Vampire (The Extractors) | 12 |
🏰 Niche Stronghold (The Protected) | 41 |
🪳 Cockroach (The Survivors) | 22 |
🧟 Zombie (The Walking Dead) | 23 |
👻 Ghost (Already Dead) | 44 |
To visualize this shift, we need to break the ecosystem down by tiers. (A single chart simply cannot capture the gap between the giants and the ghosts).
If anything should strike you with that final chart, it is how the range between networks has shrunk drastically. 2014 saw AMC lead this selected pack with 1.4m average primetime viewers, with Hallmark Mystery the lowest with 0.3m, a difference of 1.1m. Now the pair have 7k in difference.
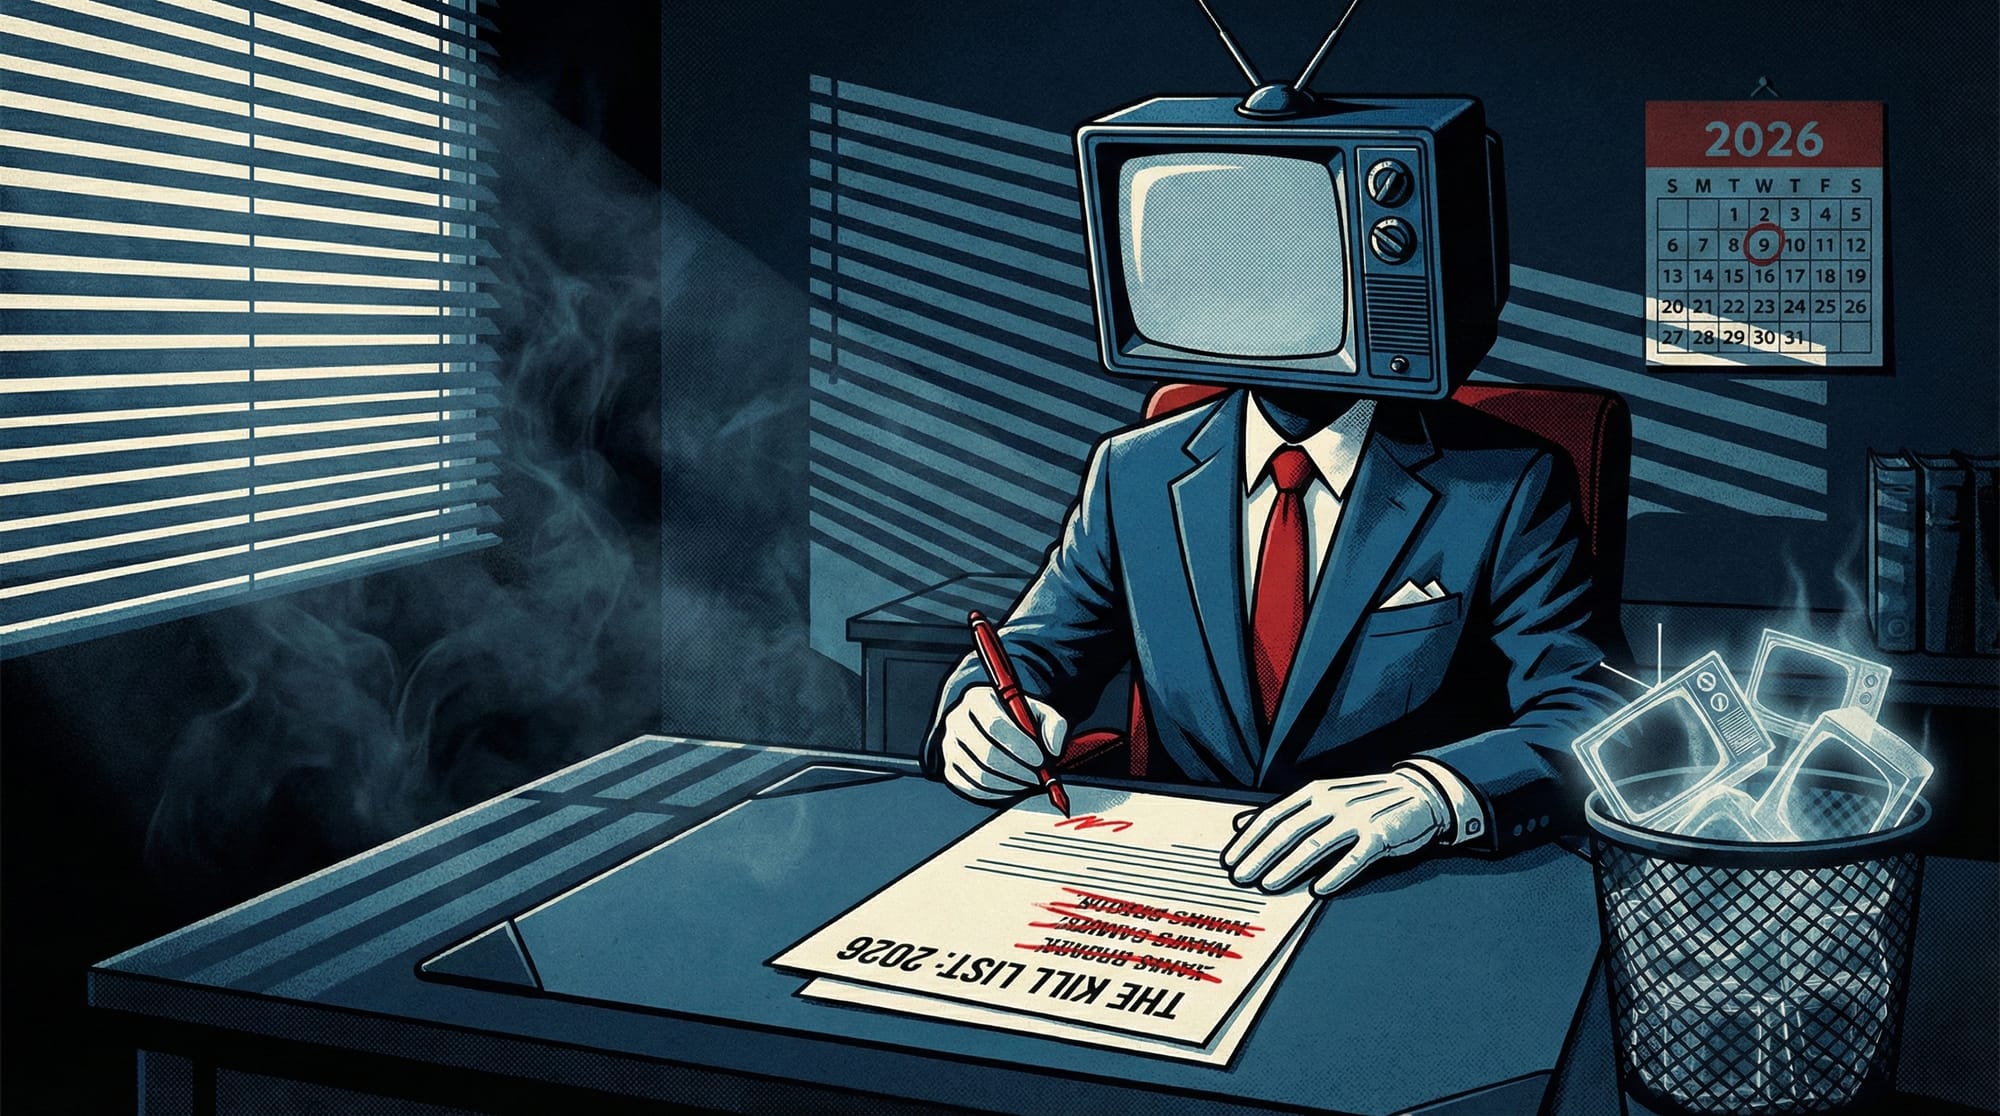
With the number of valuable networks shrinking, I anticipate 2026 to be the year of the ‘Kill List.’ MVPDs will stop paying for Ghosts. Advertisers will stop buying Vampires at premium rates. This is a topic I’ll dive deep into next time, exploring The Kill List: the 20 networks most at risk of being dropped in the next renewal cycle.